Operating Results and Analysis
Heat Map
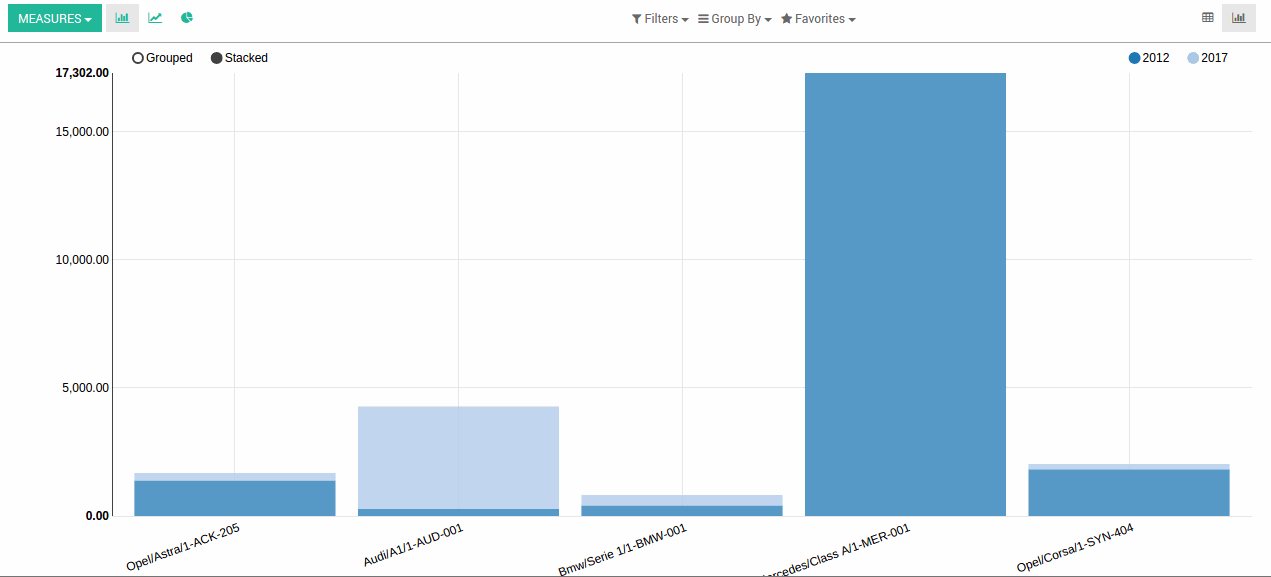
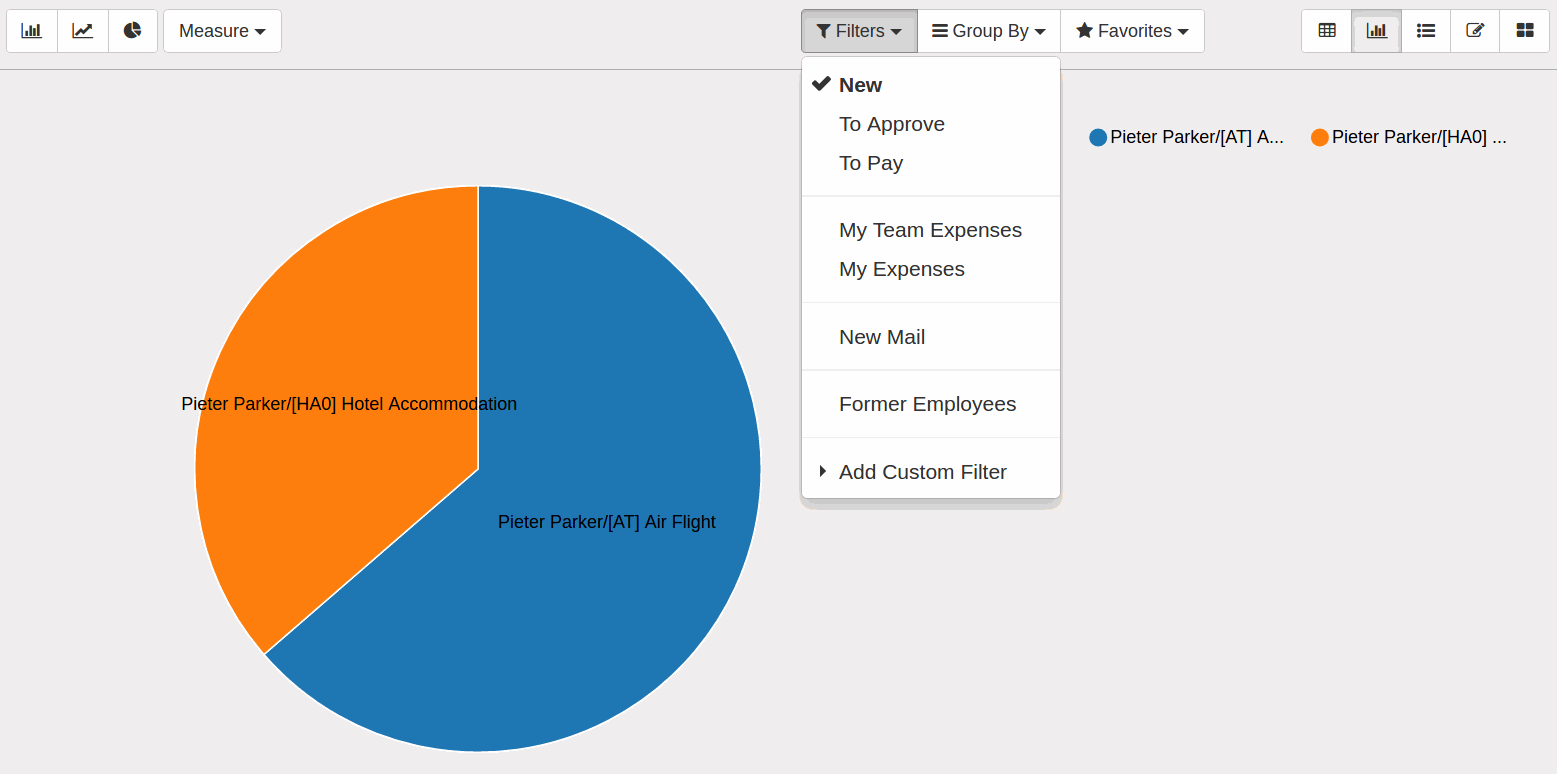
This is about graphs for visualizing data whose values are represented as colors. Consider progress of the projects and activities using the heatmap. Highlight data - you determine how many hours on a project / task / etc. have been spent. This is particularly useful for tracking the progress of projects.


